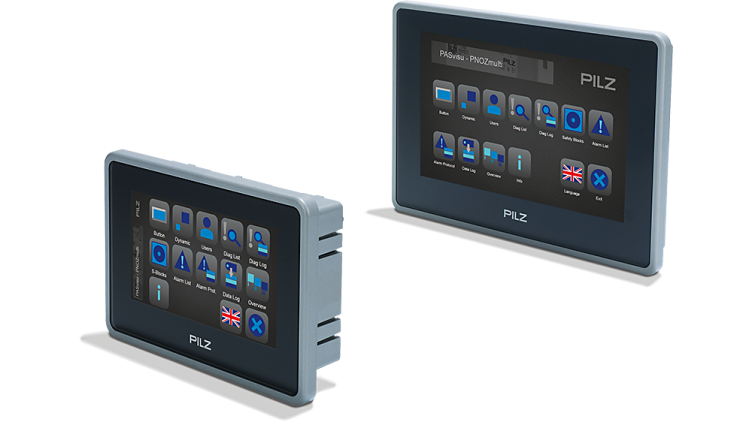
Your system visualisation is optimally displayed on the Pilz Human Machine Interface PMIvisu. The software is pre-installed and licensed on the new PMI v7e visualization panels. With this combination, you can visualise and diagnose all functions of the PNOZmulti small controllers via direct connection.
Version 1.6 of the software PASvisu also contains the so-called Advanced Trend Tile, which enables the display of logged trend curves. Filter by time history or dynamically add trend lines in the PASvisu runtime. Easy handling for efficient visualization.
More little extras:
- Adjust the font size of list tiles
- Locking visualization tiles in the PASvisu Builder so that they cannot be moved accidentally and
- Selection of the storage space for your export files directly from the runtime
